This is an example of work we did for one of our clients. This kind of approach will work with any AnyChart chart that PHPRunner and ASPRunner.NET do not support directly. Here is how you can approach this kind of task.
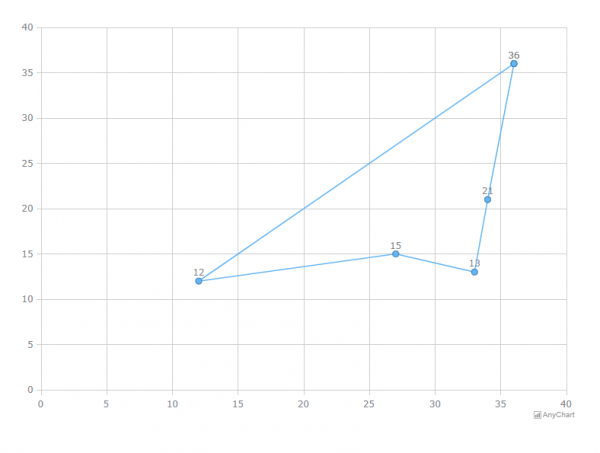
A Scatter chart is a graph that represents the relationship between two variables in a data set. Normally data is stored in the database as a set of (x,y) pairs. Here is the end result our client was looking for.
This is how it can be done
1. Create a Custom View in PHPRunner or ASPRunner.NET. Enable the View page for this custom view. This will be our chart page.
2. Open that View page in the Page Designer, remove everything you don't need and add the code snippet. Use the following code there:
PHP
echo "";
C#
MVCFunctions.Echo("");
The idea of this code is to create a container where the chart will be placed.
3. For this code snippet use the following CSS code in Page Designer:
:host {
margin-left:0px !important;
}
:host #container{
width:100%;
height:530px;
}
4. Custom View -> View Page -> BeforeDisplay event.
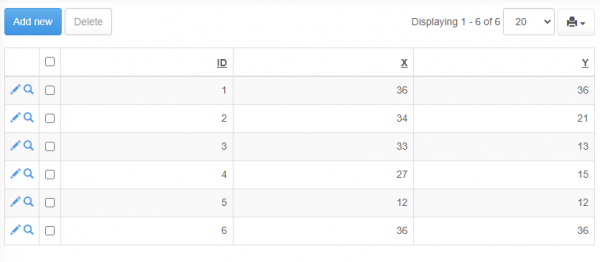
The idea of this code is to load the AnyChart library, retrieve data from the database, and pass it from the server side to Javascript using setProxyValue() function. The SQL query simply pulls all the data from the linechart table. Here is what kind of data is required to build this chart.
PHP
$pageObject->AddJSFile('https://cdn.anychart.com/releases/8.11.0/js/anychart-base.min.js');
$chartData = array();
$linechart_rs = DB::Query( "select * from linechart order by x asc,y asc" );
while( $cdata = $linechart_rs->fetchAssoc() ){
	unset( $cdata["ID"] );
	array_push( $chartData ,$cdata );
}
$pageObject->setProxyValue("chartData",$chartData);
C#
dynamic cdata = XVar.Array(), chartData = null, linechart_rs = null;
pageObject.AddJSFile(new XVar("https://cdn.anychart.com/releases/8.11.0/js/anychart-base.min.js"));
chartData = XVar.Clone(XVar.Array());
linechart_rs = XVar.Clone(DB.Query(new XVar("select * from linechart order by x asc,y asc")));
while(XVar.Pack(cdata = XVar.Clone(linechart_rs.fetchAssoc())))
{
   cdata.Remove("ID");
   CommonFunctions.array_push((XVar)(chartData), (XVar)(cdata));
}
pageObject.setProxyValue(new XVar("chartData"), (XVar)(chartData));
return null;
5. And the final step. Custom View -> View Page -> Javascript OnLoad Event.
anychart.licenseKey( Runner.anychartLicense );
chart = anychart.scatter();

var series = chart.line(proxy["chartData"]);
series.markers(true);
series.labels(true);

chart.container("container");
chart.xScale().minimum(0).ticks({ interval: 5 });
chart.yScale().minimum(0).ticks({ interval: 5 });
chart.xGrid(true);
chart.yGrid(true);

chart.xGrid().stroke();
chart.yGrid().stroke();

chart.draw();